The Lorenz System. A notebook from my complexity notebooks, written in Python with NumPy and Matplotlib.
import numpy as np
import pandas as pd
import matplotlib.pyplot as plt
from mpl_toolkits.mplot3d.axes3d import Axes3D
%matplotlib inline
# Define a function to generate the Lorenz System coordinates over a certain time span
def lorenz_system(sigma, rho, beta, dt, time):
#set initial conditions as random ints in rough ranges of behaviour
x = np.random.randint(-5,5)
y = np.random.randint(-5,5)
z = np.random.randint(5,15)
#Create Lists
x_list = []
y_list = []
z_list = []
#Add values for the run
for steps in range(round(time/dt)):
# Add values to lists
x_list.append(x)
y_list.append(y)
z_list.append(z)
# Updates Values using Euler Integration
x = x + ((sigma*(y-x))*dt)
y = y + ((x*(rho-z)-y)*dt)
z = z + (((x*y)-(beta*z))*dt)
return x_list, y_list, z_list
# Run the system using the lorenz attractor parameters and save the values
x_values, y_values, z_values = lorenz_system(10, 28, 8/3, 0.001, 100)
#define a function to plot the graph along two axes
def plot_graph(x, y, colour, title):
plt.plot(x, y, color=colour, alpha=0.7, linewidth=0.3)
plt.title(title)
plt.show()
def plot_3d_graph(x, y, z, colour, title):
#Set size of figure
fig = plt.figure(figsize=(9, 9))
#set axes as 3d projection
ax = fig.gca(projection='3d')
#Set plane backgrornd colour
ax.xaxis.set_pane_color((1,1,1,1))
ax.yaxis.set_pane_color((1,1,1,1))
ax.zaxis.set_pane_color((1,1,1,1))
# Hide grid lines
ax.grid(False)
#plot values
ax.plot(x, y, z, colour, alpha=0.7, linewidth=0.3)
ax.set_title(title)
plt.show()
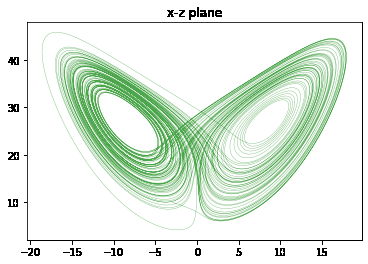
plot_graph(x_values,z_values, 'g', "x-z plane") # Plot the x-z plane
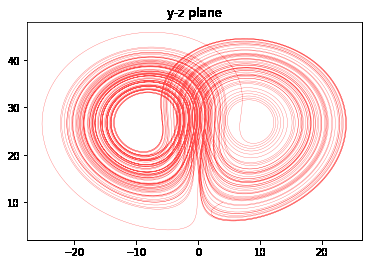
plot_graph(y_values,z_values, 'r', "y-z plane") # Plot the y-z plane
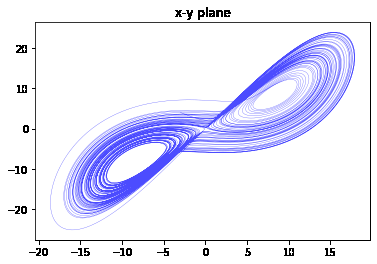
plot_graph(x_values,y_values, 'b', "x-y plane") # Plot the x-y plane
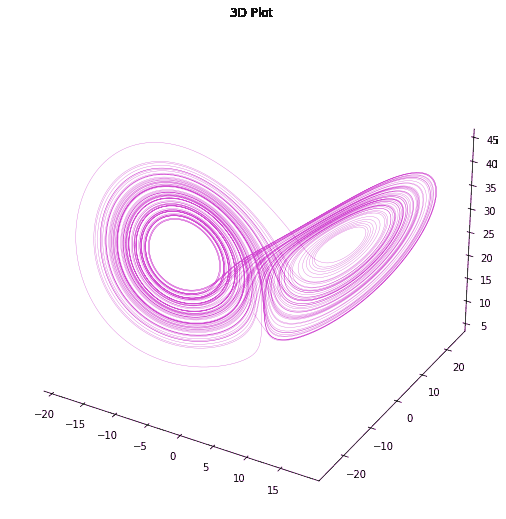
plot_3d_graph(x_values, y_values, z_values, 'm', "3D Plot")